Corpus Journal of Dairy and Veterinary Science
[ ISSN : 2833-0536 ]
Geographic Information Systems and its Applications in Veterinary Medicine
1College of Veterinary Science, Mekelle University, Ethiopia
2Department of Veterinary Surgery and Diagnostic Imaging, School of Veterinary Medicine, Wolaita Sodo University, Ethiopia
Corresponding Authors
Keywords

Abstract
Geographical information system (GIS) is a computer system that displays stored digital data on a map representing the Earth’s surface. The geographic information system was developed in the 1950s and 1960s, primarily in the public sector in Canada. GIS use maps remotely sensed satellite imagery and GPS as data sources in this information age for capture, storage, retrieval, update, analysis, display and rapid worldwide communication of data for the management of animal diseases. These are available in different formats including paper maps, electronic files of maps and associated attribute data, aerial photos, satellite images, and other sources in digital format. In this paper also, an attempt was made to give a clear view of the application of GIS in the field of veterinary medicine. GIS can be applied to different veterinary activities. It can help to understand and explain the dynamics and spreading pattern of disease and increase the speed of response in the case of a disease emergency. Additional input, such as the satellite images and information on the distribution of vectors, can correlate the disease trends and be used as an early warning tool or a tool to predict the evolution of the hypothetical introduction of a particular disease. In addition to veterinary activities, GIS is applied for designing of abattoir site suitability model using database management that can be identified and integrated into a GIS database in the form of map layers with associated attributes. The use of GIS tools in the routine activities of the majority of countries of the World is not optimal. While there is a general understanding of the advantages of using GIS in the control and prevention of animal diseases, only a few countries apply this tool regularly. This is mainly due to a lack of training for personnel and the difficulty of accessing good quality data, including digital data.
Introduction
The Spatio-temporal distribution patterns of most of the livestock diseases are complex. In this regard, the application of Geographical Information System (GIS) is valuable as it has many features that make it an ideal tool for use in animal disease surveillance, monitoring, prediction, and its control strategy. The GIS can store demographic information, etiological factors and prevalence records of disease in a geographical setting, which enables a range of spatial analysis purposes. A GIS provides noteworthy additional value to general-purpose routine data that is perceived to be inadequate epidemiologically or for supervision purposes in the veterinary profession and noticeably increases the efficacy of networking and communication strategies [1,2]. Descriptions of the dynamics of geographical diseases occurring from time to time and the risk/predisposing factors owing to spatial correlation along with sketching of risk and damage maps become realistic due to various applications of GIS. This gets reflected in cartography, neighborhood analysis, buffer generation, overlay and network analysis, three-dimensional modeling, surface area distance calculation, three-dimensional surface modeling and so on. Introduction of GIS as an alternative-tracking tool for animal disease surveillance and monitoring is of utmost importance, given the current lack of proper disease surveillance systems in the veterinary sector. The GIS may provide momentum to disease reporting, recording, cluster analysis, modeling the spread of the infection, assessing outbreak situations, and planning control strategies including disease prediction, vaccination, alerting authorities for preparedness and so on [3,4]. With the advancement of GIS, mapping for the location of herds, flocks and other related facilities is possible which proves to be helpful in the management of disease outbreak along with the improvement of management practices as well as veterinary service tasks during an emergency. Moreover, it can also be used as a powerful tool to assess various approaches being followed for preventing the spread of infectious and communicable diseases. This manuscript aims to bestow an overview of the promising and potential applications and usages of a Geographical Information System in veterinary epidemiology for advancing the knowledge of epidemiologists, diagnosticians, clinicians and researchers about this novel approach of disease surveillance and monitoring [5-7].
Geographic information system (GIS) is a computer system for capturing, storing, querying, analyzing, and displaying geospatial data [1]. Also, it is a tool for mapping and analyzing feature events on earth, and integrates common database operations, such as query and statistical analysis, with maps, as well as it manages location-based information and provides tools for display and analysis of various statistics, including population characteristics, economic development opportunities, and surveillance [8]. Additionally, GIS enables interpretation of information spatially, looking for patterns, trends, and relationships that might exist between disease (other occurrences), demography, environment, space and time [2,9]. GIS was begun in the 1950s, primarily in the public sector in Canada [1,10]. The system has been developing rapidly in the past, and today several softwares are more user-friendly than in the past. Recent advances in information technology including hardware, software, and the internet have provided capabilities to potentially enhance problem-solving in areas that require information processing [6,11]. Currently, with the maturing of GIS industry and the development of Geographic information science surrounding the technology, the application of GIS in various fields has been increasing to exploit the current GIS achievement [3,12]. Most of the information around our world incorporates a location reference that places this record sooner or later in the world [2,12]. To discover geographical data on a map, we use either maps that use a coordinate system to permit places to be read (examine), or we use shapes of the geographic data, which are shapes of the features and subject matters that are drawn onto the map. Capabilities of GIS could screen links between distinguishing sources of data when it is offered on a map and then discover relationships among features so that it creates regularly new records from current information resources which might be very beneficial for decision making [5,7]. There are numerous regions in which GIS can be implemented. Among them, veterinary geo-informatics has become the most effective approach for surveillance via which generally manages and eradication of animal diseases, which do not appreciate spatial or temporal distribution boundaries, are established [9,13]. diseases such as rift valley fever, and foot and mouth disease, in addition to the new and emerging zoonotic diseases of veterinary public health significance including avian influenza and severe acute respiratory syndrome (SARS), are commonly epidemic and are of significant socioeconomic and public health relevance in the world. GIS, therefore, has wide-ranging applications in veterinary surveillance for predicting these diseases via facilitating outbreak response. In addition to veterinary surveillance, GIS is carried out for designing of abattoir site suitability model using database management that can be recognized and integrated into a GIS database in the form of map layers with related attributes [2,14]. Thus, this paper is organized to highlight the components, principles, and application of GIS in the field of veterinary medicine.
Geographic Information Systems (GIS)
Historical background of GIS
A geographic information system is a computer-based system to aid in the collection, preservation, storage, analysis, output, and distribution of spatial data and information [2,15]. The association of geographical information has described GIS in phrases of computerized database management systems for capturing, storing, checking, integrating, manipulating, analyzing and showing information which might be spatially referenced to the Earth with a primary role to integrate information from a variety of sources [14,16]. There is a general agreement that GIS technology needs strong analysis and modeling capabilities as to a general-purpose tool for handling spatial data. Hence it can be defined as a special case of information systems where the database consists of observations on spatially distributed features, activities, or events, which are definable in space as points, lines, or areas to retrieve data for queries and analysis [4,17]. Therefore, GIS is a powerful set of tools for storing and retrieving spatial data at will, transforming and displaying spatial data from the real world for a particular set of applications [7].
GIS was developed in the 1950s and 1960s, primarily in the public sector in Canada. In the 1960s and 1980s, a vigorous GIS industry developed, with clear USA leadership [2,10]. In the mid-1980, with the maturing of the GIS industry and the development of the Global positioning system surrounding the technology (GPS), GIS was started to be applied for military purposes [3,8]. GIS has had a major influence on the discipline of Geography in the 1980s and 1990s, variously seen as a critical factor in reviving academic geography. In the 1990s, a literature critical of GIS technology has emerged raising questions of ethics, equity technological biases, assess and privacy, to name a few. Recently, with the maturing of GIS industry and the development of a Geographic information science surrounding the technology, the application of GIS in various fields has been increasing to exploit the current GIS technology [18,19].
Basic components of GIS and their functions
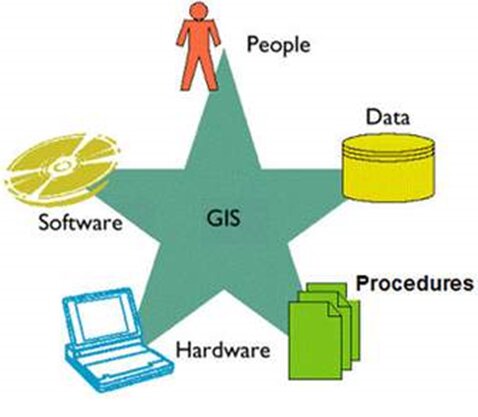
Like any other information technology, GIS requires the following basic components to work with geospatial data on a database management system (DBMS). When considering the function of a GIS there are several issues with the components of GIS that have to be taken in to account. These are hardware, software, skilled People, data, and infrastructure [2,14] (Figure 1).Hardware is the component that includes the computer and the operating systems to run GIS. Typically, the choices are personal computers that use the Windows operating systems. Additional equipment includes storage devices, Output devices, and input devices such as tape driver, digitizer, scanner, GPS receivers and mobile devices for fieldwork [2,18]. Software includes the program and the user interface for driving the hardware. Examples of software are ArcGIS, Arc View, Ermappe, ENVI, GRASS, and others [2,12]. Skilled people refer to GIS professionals and users who define the purpose and objectives, and provide the reason and justification for using GIS [8]. Data consist of various kinds of inputs that the system takes to produce information. It is a crucial resource but expensive to collect, store and manipulate because large volumes are required to solve substantial geographic problems. The infrastructure includes requisite skills, data standards, data clearinghouses; and general organizational patterns, as well as network systems (Intranet or Internet). The functionality of a GIS can be subdivided into four main component subsystems. These are data input, data storage and management, data manipulation and analysis, and data output [2,14].
Data input refers to the process of identifying and gathering the data required for a specific application, involving the acquisition, reformatting, geo-referencing, compiling, and documenting the data. Data manipulation and analysis is the science of using a GIS is to know how to combine the analysis functions available on a particular system to provide the required information using the available data. The quality of the information produced from a GIS depends on the intelligent use of a systematic analysis approach [7,17,19].The data storage and management component of a GIS incorporates those functions concerned with the storage and retrieval of data from the database. The methods employed to implement these functions affect how efficiently the system performs all operations with the data. The data output component of GIS provides a way to see the data or information in the form of maps, tables, diagrams, and so on.The results may be output in hard-copy, soft-copy, or electronic format [2,3].
Figure 1: Major components of GIS.
The Nature of geographic data
The geospatial data separate GIS from other information systems. Consequently, GIS operations should reflect the character of geospatial. Data consider an instance of disease outbreak, to explain the outbreak spatially, we must refer to its location and traits (e.g. severity) [11]. Hence, the information for a geographic feature has four fundamental components: its geographic position, its attributes, spatial relationships, and time [14]. The geographic position is essential to the description of geographical items referring to locational data (which associate the objects to their location in geographical space). Geographic information is a form of known as spatial data [5]. They may be represented on a map or in a geographic information system as point, line, or area features. Points are used to symbolize the region of geographic phenomena at a point. For instance, the location of the outbreak foci could be represented by a point. Lines are used to representing line features that are too narrow to be represented as an area or features that theoretically have no width. An area feature is a region enclosed by line features. The geographic extent of a city, a forest stand, or a lake could be represented by an area element. Area elements in GIS are often represented as polygons. A polygon is a closed plane figure bounded by straight lines [1,6,14].Attributes are the second characteristics of geographic data and their attributes (which describe the properties of the objects other than their locations). They are representations of the characteristics, qualities, or relationships of map features and geographical locations. Geographic information is referenced to a point in time or a period of time.Knowing the time when geographic data were collected can be critical to using those data appropriately
Data model and GIS representation:
While the data model defines how spatial features are represented in a system, GIS representation refers to the use of a GIS and its functionalities in constructing a model with geospatial data. The data models that widely accepted are two types of data representation for spatial features. Vector and raster data models are fundamental approaches to the representation of the spatial components of geographic information [5]. In the vector model, items in the real world are represented using the points and lines that define their boundaries much as if they were being drawn on a map. in the vector approaches the homogeneous units are the points, lines, and polygons as noted above [1]. Relative to the raster approach, these homogeneous units are relatively few in number and variable in size. This model affords a much more flexible and commonly more precise coordinate position than the row and column positioning used in the raster method [6,20]. homogeneous units, which can be the cells. Areas are made of continuous pixels with the same value, and the area within a cell isn’t subdivided and the cell characteristic applies to each place within the cell. Lines are made through connecting cells into a one-pixel-thick line. Points are single cells, which imply that all the area represented through that cell turns into unavailable for other spatial entities [2,7,21].
Data Sources of Geographic Information Systems (GIS)
Paper map
The most known source of geographic information maps, in which information about the world around us is plotted within a coordinate system that allows us to find its location. Mapping is a common technique of displaying the geographical distribution of disease and associated risk factors with the aid of digitizing maps [2,22]. There are three fundamental procedures when we digitizing paper maps into a digital format. First, digitizing refers to the process of converting data from analog to digital format. Second, scanning is a digitizing method that converts an analog map into a scanned document. Third, map registration is the transformation of a digitized map from a source coordinate system to the geographic coordinate system or projected coordinate system using tics marks. It requires the mutually identified control points (tics), from which digitizing typically starts with a set of control points which can be later used for converting the digitized map to actual-world coordinates [20,23,24].
Remote sensing
Remote sensing is the science and art of obtaining information about an item, area, or phenomenon through the analysis of data obtained by a device that isn’t in physical contact with the object, area, or phenomenon under investigation. In such a manner, information is gathered in the form of digital photos of the earth’s surface from airborne or satellite platforms and transforming them into maps. Therefore, remotely sensed data should help in the identification of interested risk areas [2,25].
Global positioning system
The Global Positioning System (GPS) is a satellite-based navigation system made of a network of twenty-four satellites placed into orbit by using the DOD that transmits precise microwave signals. The microwave signals latter allow the GPS receiver to determine its location, direction and time. GPS can be used to collect data for GIS documentation activities and track their projects in a database. Data from GPS can be utilized in association with existing spatial databases, both for updates and a range of applications in spatial decision making [12,19].
Applications of GIS in Veterinary Medicine
The variety and type of applications that can be accomplished with the aid of a GIS are as large and diverse as the available geographic data sets [17]. As far as veterinary medicine is involved GIS has wide-range applications, such as outbreak response. More specifically, GIS can be used for prevention and eradication of disease, disease surveillance, understanding and explaining disease dynamics and spreading patterns, as well as the correlation of disease trends with climate for disease predictions [6,11].
Applications of GIS-functions in the veterinary surveillance
Veterinary surveillance is the discipline of continuously gathering, studying, and interpreting data about diseases, and disseminating conclusions of the analyses to relevant organizations. In a broader sense, veterinary surveillance has been equated with the routine health information system which offers a concept about the entire health situation [2]. Information is obtained via gathering, recording and analyzing of data that focused on the interesting subject matter, so that action may be taken to control diseases, within a predefined period of time, and at predefined durations. Surveillance for the disease involves mapping the disease in terms of disease, host, vector, and parasite [5,19].
Recording and reporting disease information:
GIS can be used to record information on disease incidence, prevalence, mortality, and morbidity on maps of farm, region, or national levels, and that information is more easily understood when visualized on a map. For example, the spread of a disease can be determined from two or more interpretations of the extent of a disease made at different times. According, Tushemereiwe et al. [26] published a paper showing the reported annual spread of disease in Uganda for the years 2001 to 2006. The data were collected by a nationwide participatory action where farmers were urged to report disease, which was then verified by extension officers. Then, recorded and reported results clearly showed that there is a strong decline in the newly affected area from the year 2004 to 2005, which is likely a result of the control measures taken during that time [26,27].
The density function is another way to describe the incidences of diseases in a defined area by recording disease information, creating density maps. The density function creates a grid with defined cell size and gives each cell in the area a density value of the infected farms. To adjust for the underlying population, a density map of the whole population at risk is recorded with the same cell size. The density maps are then divided to provide a map that shows the incidence of the particular disease in each area unit at the time unit chosen. This further provides maps that show the spread of the disease by displaying the maps as a movie [11,17]. Maps displaying the updated situation in a region, together with farm information are important tools for field personnel, and can also be incorporated in reports to producers, administrators and the media. Therefore, the GIS incorporated maps are a basic element in recording and reporting of real-time outbreak notification [2,11].
Understanding disease dynamics and spreading patterns: GIS helps in understanding and explaining disease with the environment and spreading patterns. In this case, environmental changes have a major contribution to the pattern of disease spreading and distribution [28]. Suppose GIS was used to develop a risk assessment model for fasciolosis in Ethiopia where both Fasciola hepatica and Fasciola gigantica occur as a cause of major economic losses in livestock. A regional F. hepatica and F. gigantica forecast index maps are created; then, results were compared to environmental data parameters and to available Fasciola prevalence survey data that is mapping survey data and then iteratively fitting them to associated climatic and edaphic conditions [2,29].
Buffer zones that are generated around risk areas or point sources, such as roads where infected cattle have been driven or around market places, show outbreak area. Buffer zones can be drawn around those farms and with a link to tables of the addresses of the farms at risk, then farms can be informed within a short time after a notified outbreak. In such cases an outbreak of an infectious disease, GIS can provide an excellent tool for identifying the location of the case farm and all farms at risk within a specified area of the outbreak [11,15]. GIS has been widely applied to the understanding and explaining of malaria. For example, in Africa, GIS has been used to generate models of malaria occurrence, seasonality and transmission intensity using climatic and remotely sensed data. The outputs of such models have been combined with population data to estimate population exposure, mortality, and morbidity, and to analyze and project the effects of climate change on malaria [3,30].
Planning disease prevention and eradication strategies: An essential part of disease control is the ability to document the occurrence of disease with the goal of prevention and eradication by the use of overlay analysis [15]. Hence, GIS can synthesize and continuously update information on disease causes and associate this information with environmental factors, and overlay the thematic layers to analyze databases and produce maps that combine spatial and temporal information from various sources (disease cases, vector breeding sites so on). Details on disease risk and fundamental perspectives of where (distribution), why (environmental determinants), how much (transmission intensity) and when (seasonality) disease occurs can be stored and analyzed. Thus, trends and seasonal changes can be predicted using multi-date data so that strategies going to be taken are planned for the prevention of diseases [2,7,31].
In the planning of prevention and eradication of diseases, GIS has the possibility of neighborhood analysis functions. The strategies involve finding high or low-risk areas for diseases that depend on geographical features or conditions related to geography [9]. The neighborhood analysis function identifies all adjacent features with certain criteria for a particular feature. For instance, it can be used to identify all adjacent farms to an infected farm in which contact patterns such as common use of grasslands or sources of purchasing, etc. could be visualized with a so-called spider diagram. This could provide insight into the possibility of transmission of infectious diseases between herds, so that action can be taken to control diseases [11,13].Studies of trypanosomiasis and theileriosis are just some examples of how to use GIS to plan eradication of diseases depending on habitats of vectors or wild animal populations [31-33]. GIS could also be used to find areas with a low density of other farms or risk areas of diseases as shown in the case of Echinococcus multilocularis in foxes [2,5].
Correlation of disease trends with climate for disease prediction:
GIS can correlate disease trends with climatic variation and other information such as environmental variables that could be used for predictions. Diseases and vectors are often related to environmental variables, such as elevation, humidity, and precipitation. Many viruses are spread by insects that may dislike high altitudes, whereas most fungal diseases require high relative humidity for growth. In this condition, correlation is seen between disease incidence and environmental variables [2,12]. RVF has been recognized in African countries, with an underlying association with high rainfall and dense populations of vector mosquitoes. The response of vegetation to increased levels of rainfall can be easily measured and monitored by Remote Sensing Satellite Imagery. The quantities of rains reflect on the vegetation coverage which becomes higher than normal and can be monitored by satellite images. This monitoring of the situation can help in designing risk maps of the possible occurrence of outbreaks of RVF. These findings have enabled the development of forecasting models and early warning systems for RVF using satellite images and weather forecasting data. Early warning systems, such as these, could be used to detect animal cases at an early stage of an outbreak, enabling authorities to implement [12,19].
Besides, RVF outbreaks in East Africa are closely associated with the heavy rainfall that occurs during the warm phase of El Nino. El Nino refers to the large-scale oceanatmosphere climate phenomenon linked to a periodic warming in sea-surface temperatures across the central and east-central equatorial Pacific. Scientists have discovered that the combination of warmer than normal equatorial Pacific Ocean associated with El Nino and rising sea-surface temperature in the western equatorial Indian Ocean increases the quantities of rains that become higher than normal. This increases the number of mosquitoes and their distribution and can trigger outbreaks of RVF in Eastern Africa. This discovery has increased the capability of forecasting to predict climatic conditions that are frequently associated with an increased risk of outbreaks and may improve vectorborne disease control [34,35].
Application of GIS and its current status in Ethiopia
GIS applications are very wide and are used in routine human activities. It is used for marketing studies, telecommunications, and location of restaurants, museums and hospitals; in tracking trucks traffic; in establishing maps of animal population density by species or maps of vegetation coverage change; in locating forests, rivers, and mountains; and in determining soil compositions to name few in developed countries[12]. However, the application of GIS tools in the routine activities of the majority of developing countries including Ethiopia is not optimal. Factors that are not optimizing the use of GIS include lack of awareness by decision-makers; low stock of base data; uncertain data discovery, access and exchange mechanisms; and insufficient human and technical resources [14].
While there is a general understanding of the advantages of using GIS in all human activities particularly in veterinary medicine for animal disease surveillance and other applications, only a few countries apply this tool regularly [13]. This is mainly due to a lack of training for personnel, the difficulty of accessing good quality data, and cost indicated to produce quality data. From this origin, our country also is not using GIS efficiently; however, there are some evidences currently in that GIS was applied in Ethiopia. Among some GIS was applied in Ethiopia a good example for strategic control of fasciolosis, malaria management, and abattoir construction site suitability model are veterinary concerned research applications. The rest few were done on climate change and desertification, land use planning and monitoring, municipal application, hydrology surveys, Soil surveys, geological Surveys, and demography [14,29,30].
Future Perspectives of Geographic Information Systems (GIS)
A continuing challenge in GIS science and many other fields is the efficient and economical processing of massive data sets [2,36]. This describes how to leverage a massive parallel processing unit (GPU) for raster GIS operations. Using video-gaming cards to create parallel processing solutions within the GPU is relatively new and almost nonexistent in GIS science. So, in the future by designing a software add-on built to run select raster analysis operations on GPU will able to achieve a 7 times speed improvement compared to the traditional raster processing system [2,7,19]. The power of GIS relies on its ability to merge geographic information with the information of veterinary medicine [9]. Thus, it is certain that the scope of application for GIS will rapidly increase. For instance, once an individual animal identification (e.g. microchips and passports) is developed and widely used, GIS could be used to track animals from farm of origin through sale yards to slaughter houses and even cross state boundaries. Monitoring the movement of food farm to table will assist food safety and quality assurance programs in locating potential sources of contamination. Furthermore, GIS can define sub-regions for export based on natural geographic or animal production characteristics instead of political boundaries. This information then could be used to ensure the quality of foods intended for national and international markets [6,17].
Many factors undermine the ability of a developing country to use spatial information (GIS) effectively in the planning process. However, the way to meet these challenges is the creation of options, collectively known as spatial data infrastructures (SDI), which flourishes a country’s ability to use geo-information effectively, have been identified. These are the existence of core data sets; the accessibility of documentation about existing geo-information; adherence of geo-information to accepted standards; policies and practices promoting the exchange and reuse of geo-information; and sufficient human and technical resources to collect, manipulate and distribute geo-information. They are a robust response to the challenges that country confronts in the use of spatial data and its transformation into information and knowledge that are needed for decision making and the creation of veterinary SDI, using developed countries geo-information that is an imperative requirement if the impact of animal diseases on developing countries is to be solved [1,3,13].
Conclusion and Recommendation
GIS is a computer system for processing, storing, checking, integrating, manipulating, analyzingand displaying data related to positions on the surface of the earth. It is then presented cartographically, graphically or as a report. GIS enables interpretation of information spatially, looking for patterns, trends, and relationships that might exist between disease (other occurrences), demography, environment, space and time. GIS can be applied to different veterinary activities. It can help to understand and explain the dynamics and spreading pattern of disease and increase the speed of response in the case of disease emergency. Additional input, such as paper maps, satellite images from remote sensing and GPS, and information on the distribution of vectors, can correlate the disease trends and be used as an early warning tool or a tool to predict the evolution of the hypothetical introduction of a particular disease. While there is a general understanding of the facilities offered by the application of GIS in the control and prevention of animal diseases generally and for designing of abattoir site suitability model using database management, only a few countries applying this tool regularly. The lack of training of the personnel and the difficulty to access good quality data, including digital data, are the main handicaps in the use of GIS by the majority of the countries of the World. In conclusion, the animal information system needs to be qualitatively strengthened by optimizing routine data collecting and storing system into a computer database. Such automatically stored data should be more spatially balanced in terms of the density of sampling points. Moreover, the existing GIS data that were sampled through satellite imagery for animal disease should be strengthened, or improved by field surveys to facilitate the linkage of disease spread to socioeconomic data. It will also allow better predictions of the disease spread over time. Infrastructures that aid in facilitating the application and use of GIS in veterinary medicine should be provided by the government, in addition to training of veterinary professionals in the usage of GIS in the veterinary field in Ethiopia
References
- Bolstad P (2016) GIS fundamentals: A first text on geographic information systems. Eider Press Minnesota.
- Mengistu TS, Haile AW (2017) Review on the application of geographical information systems (GIS) in veterinary medicine. Int J Vet Health Sci Res 5(4): 176-182.
- Eisen L, Eisen RJ (2011) Using geographic information systems and decision support systems for the prediction, prevention, and control of vector-borne diseases. Annual review of entomology 56: 41-61.
- Maghraby A, Saleh M, Eassa F (2012) Geographic information system based on mobile agent and ontology. Journal of King Abdulaziz University: Engineering Sciences 149: 1-38.
- (2004) Durr PA, Gatrell AC (Eds.), GIS and spatial analysis in veterinary science. CABI, UK.
- Kuldeep D, Verma A, Ruchi T, Sandip C, Kranti V, et al. (2013) A perspective on applications of Geographical Information System (GIS): An advanced tracking tool for disease surveillance and monitoring in veterinary epidemiology. Advances in Animal and Veterinary Sciences 1: 14-24.
- Zhang X, Chen N, Chen Z, Wu L, Li X, et al. (2018) Geospatial sensor web: A cyber-physical infrastructure for geoscience research and application. Earth-science reviews 185: 684-703.
- Goodchild MF, Haining RP (2004) GIS and spatial data analysis: Converging perspectives. Papers in Regional Science 83(1): 363-385.
- Babalobi O, Onyeka L, Ogundipe G (2005) Towards an increasing awareness and use of veterinary geo-information technologies in Nigeria: A review. Vom J Vet Sci 1: 45-51.
- Curran PJ (1984) Geographic information systems. Area 16(2): 153-158.
- Norstrøm M (2001) Geographical information system (GIS) as a tool in surveillance and monitoring of animal diseases. Acta Veterinaria Scandinavica 94: 79-85.
- Jebara KB (2007) The role of Geographic Information System (GIS) in the control and prevention of animal diseases. In Conf OIE pp. 175-183.
- Babalobi OO (2007) Veterinary geographic information systems applications in Nigeria: limitations, challenges and needs. Veterinaria Italiana 43(3): 491-499.
- Melese A (2002) Application of GIS for urban planning in Ethiopia with particular reference to abattoir site suitability analysis for Kulito town: an Exploration, Addis Ababa University, Addis Ababa, Ethiopia.
- Thursfiel M (2005) Veterinary epidemiology (3rd edn) Black well science Ltd, UK.
- Bailey T (1990) GIS and simple systems for visual, interactive, spatial analysis. The Cartographic Journal 27(2): 79-84.
- Pfeiffer D, Hugh Jones M (2002) Geographical information systems as a tool in epidemiological assessment and wildlife disease management. Revue Scientifique et Technique-Office International des Epizooties 21(1): 91-102.
- Chang KT (2006) Introduction to geographic information systems. McGraw-Hill Higher Education Boston, USA.
- Sivaraj N, Kamala V, Reddy MT, Pandravada S, Babu BS, et al. (2019) Geographical Information System and Management of Horticultural Genetic Resources with Special Reference to India. In Conservation and Utilization of Horticultural Genetic Resources, Springer Publisher, USA. pp. 483-506.
- Kumar K (2018) Identification of library location through ArcGIS software: Geographical information system. BS Publications, 227.
- Broome FR, Meixler DB (1990) The Tiger data base structure. Cartography and Geographic Information Systems 17(1): 39-47.
- Jacoby S, Smith J, Ting L, Williamson I (2002) Developing a common spatial data infrastructure between State and Local Government-An Australian case study. International Journal of Geographical Information Science 16(4): 305-322.
- Comber A, Fisher P, Wadsworth R (2005) Comparing statistical and semantic approaches for identifying change from land cover datasets. Journal of environmental management 77(1): 47-55.
- Masser I (1999) All shapes and sizes: the first generation of national spatial data infrastructures. International Journal of Geographical Information Science 13(1): 67-84.
- Lillesand TM, Kiefer RW, Chipman J (2000) Remote sensing and image interpretation. John Willey & Sons, New York.
- Tushemereiwe W, Okaasai O, Kubiriba J, Nankinga C, Muhangi J, et al. (2006) Status of banana bacterial wilt in Uganda. African Crop Science Journal 14(2): 73-82.
- Manyong VM, Legg C, Mwangi M, Nakato V, Coyne D, et al. (2008) The potential benefits of GIS techniques in disease and pest control: an example based on a regional project in Central Africa. Acta horticulturae 879: 333-340.
- Theophanides M, Anastassopoulou J, Theophanides T (2014) Geographical information systems and air pollution simulation for Megalopolis’ electric power plant in Peloponnese, Greece. Journal of Environmental Science and Health 49(9): 1045-1053.
- Yilma J, Malone J (1998) A geographic information system forecast model for strategic control of fasciolosis in Ethiopia. Veterinary parasitology 78(2): 103-127.
- Craig MH, Snow R, le Sueur D (1999) A climate-based distribution model of malaria transmission in sub-Saharan Africa. Parasitology today 15(3): 105-111.
- Tami A, Grillet ME, Grobusch MP (2016) Applying geographical information systems (GIS) to arboviral disease surveillance and control: A powerful tool. Travel medicine and infectious disease 14(1): 9-10.
- Perry BD, Kruska R, Lessard P, Norval R, Kundert K (1991) Estimating the distribution and abundance of Rhipicephalus appendiculatus in Africa. Preventive Veterinary Medicine 11(3-4): 261-268.
- Rogers DJ (1991) Satellite imagery, tsetse and trypanosomiasis in Africa. Preventive Veterinary Medicine 11(3-4): 201-220.
- Anyamba A, Linthicum KJ, Tucker CJ (2001) Climate-disease connections: Rift Valley fever in Kenya. Cad Saude Publica 17: S133-S140.
- Bernardi M (2001) Linkages between FAO agroclimatic data resources and the development of GIS models for control of vector-borne diseases. Acta tropica 79(1): 21-34.
- Clarke KC, McLafferty SL, Tempalski BJ (1996) On epidemiology and geographic information systems: A review and discussion of future directions. Emerging infectious diseases 2(2): 85-92.