Journal of Mineral and Material Science
[ ISSN : 2833-3616 ]
On the Human Infectious Disease COVID-19 Protective Clothing
1School of Information and Mathematics, Yangtze University, Jingzhou, Hubei, China
2Hospital, Hubei University of Technology, Wuhan, Hubei, China
3School of Science, Hubei University of Technology, Wuhan, Hubei, China
Corresponding Authors
Keywords

Summary
The temperature distribution and thickness design of the human infectious disease COVID-19 protective clothing are studied in this paper. Based on the data provided by China mathematical modeling competition in 2018. We establish the temperature distribution model and skin layer heat conduction and burn model. The interface continuous conditional difference method, differential iterative method, least squares method and the chasing method are used to solve the given temperature distribution on the human infectious disease COVID-19 protective clothing in the environment, and analyze the human infectious disease COVID-19 protective clothing meeting the actual needs.
Introduction
When working in a high temperature environment, workers often need to wear adiabatic protective clothing, which can effectively prevent heatstroke, burns and other injuries, often have the characteristics of flame retardancy, liquid repellency, etc. Many researchers have carried out the material and thickness of the garment. Designed to increase the thermal insulation performance. Tian et al. [1] applied numerical simulation to evaluate the performance of the human infectious disease COVID-19 protective clothing, and summarized the characteristics and disadvantages of typical heat conduction model and skin burn model. Zhang et al. [2] analyzed the development status and defects of temperature-adjustable protective clothing at home and abroad, analyzed the mechanism of phase change materials in protective clothing, and explained its application in protective clothing. For the application of phase change materials, Fanglong Zhu et al. [3] conducted more in-depth research, analyzing from the aspects of reducing thermal stress, improving the comfort of protective clothing, preventing sudden changes in temperature, etc. Zhang Chao et al. [4] al took into account human physiological indicators, used the dummy model to simulate the heated scene, and established a human-clothing-environmental thermal protective clothing evaluation standard. Lin Jianbo et al. [5] studied the radiant heat penetration resistance of thermal protective clothing and selected two suitable thermal protective clothing materials. MJ Slapak & Cheng Yan [6] contrasts PBI fibers with other insulating materials to highlight their superiority as a thermal protective clothing material. Jie Yang & Rixiang Qiu [7] analyzed the research status of thermal protective clothing in the police field and introduced the development status of the new thermal protective material aerogel. Hongyan Li et al. [8] used 13 kinds of flame retardant fabrics as experimental samples, using statistical methods to obtain protective performance and fabric thickness, areal density; tpp value is positive related. Shen Lanping et al. [9] designed a double-layer thermal protective clothing fabric from the end use of flame retardant thermal protective clothing. Wang Weiwei et al. [10] used the improved finite difference method to establish a heat transfer model and optimized the thickness of each layer of thermal protective clothing. Lu Linzhen et al. [11] calculated the temperature value of each fixed contact surface with time, predicted the critical time of the burn level, and prevented skin burns. In this paper, the temperature distribution outside the protective clothing is studied with time and distance. Lu Linzhen [12] also carried out related research and established the heat transfer model of the protective clothing-air layer-skin system, and the influence of some parameters on the protective performance. In addition, this paper optimizes the thickness of the garment in a specific environment to achieve the best protection.
Protective clothing temperature distribution model
The protective clothing studied in this paper is divided into four layers. A straight line of vertical protective clothing is selected as the research object. The outer side of the first layer is taken as the origin, and the horizontal direction is directed to the positive direction of the skin layer to establish the x-axis. The arrangement relationship of each layer is shown in (Figure 1). As shown, it is assumed that the layers are tightly connected and the density of the medium is uniform, wherein the thickness of the mth layer is recorded as lm (m=1, 2, 3, 4), and 
Generalized equation: 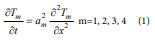
the temperature distribution function of each layer is Tm(x,t) ( m = 1, 2, 3, 4) where 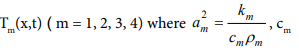
is the specific heat capacity of the mth layer, ρm is the density of the mth layer, km is the thermal conductivity of the mth layer. The analysis of the conditions for the solution of the above-generalized equations is as following. Initial conditions: Assume that the initial temperature of each point of the protective suit is the Same, so there are initial conditions,
Where w0 is the temperature of the protective clothing before entering the laboratory, the protective clothing has been worn before entering the laboratory, so it is assumed that the temperature is equal to the human body temperature.
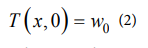
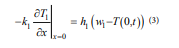
Boundary conditions: For the actual situation of the protective layer and the contact surface, we use the third type of boundary conditions and interface continuous conditions. According to the Heat Transfer theory, when there is heat exchange between the solid and the fluid, the third type of boundary condition is used.
Where T (l, ∞) is a stable temperature maintained by the left boundary of the first layer after a long period, h is the heat exchange coefficient that is a constant determined by the material on both sides of the contact surface. When the two objects are in full contact, the temperature of the contact surfaces of the two objects and the heat flux density value are equal,
The left end boundary condition of the first layer
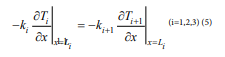
For the left boundary of the i-th layer (Figure 1), the left side is air fluid, and the right side is the i-th layer of clothing material, then
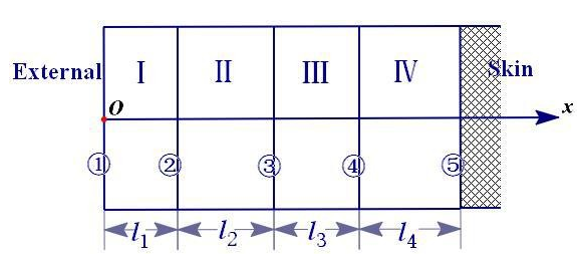
Figure 1: The arrangement relationship of each layer
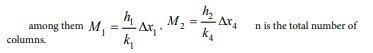
among them h1 is the heat exchange coefficient between the i-th layer and the air, w1 is the outside temperature, w1 =75. x =Lm (m = 1, 2, 3)
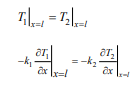
Contact surface boundary condition
For x=Lm, two sides are solid clothing materials, there are temperature equations
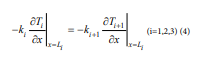
Heat flux density equation
The IV layer right end boundary condition
For the right edge of the iv layer (Figure 1), there is a third type of boundary condition
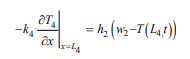
where w2 is body temperature. A partial differential equation model of the temperature distribution of the protective suit is obtained from the above formula (1)-(5).
Determination of temperature distribution
Difference method: To solve the differential equation of equation (1), convert the differential equation into a difference equation. The table represents the coordinate x on the horizontal axis and the time t on the vertical axis. The content is the temperature at the corresponding coordinate x and time t, temperature function T( x, t ). Ti,j indicates the temperature corresponding to the j coordinate x at the i time t, as shown in Figure 2.
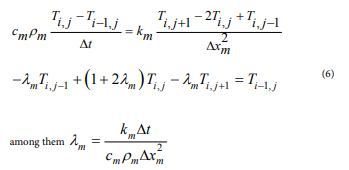
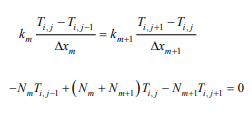
Heat conduction equation difference: For the solution of differential equations, it is often considered to differentiate the differential equations. The partial derivatives of the differential equations of equation (1) can be transformed. From the first-order backward difference quotient and the second-order center difference,
The third type of boundary condition difference method: For the third type of boundary conditions, the difference is used to discretize the boundary conditions, and the boundary temperature is calculated. At the left and right edge,
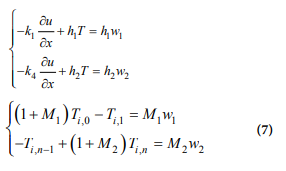
Interface continuous condition difference: At the interface of different materials, because the parameters on both sides are different, and the heat conduction equation is different, the temperature value cannot be obtained by equation (3). In this paper, the difference in cross-section temperature and the equal heat flux density are considered, and the difference is symmetrized to obtain the interface. It is temperature function differentiation method.
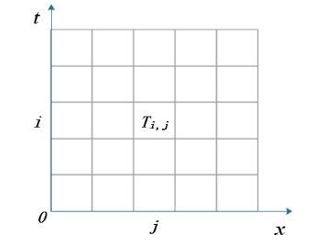
Figure 2: Time-coordinate table.
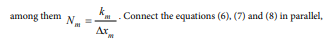
transform into a linear system of equations, and use the chasing method to solve the equations.
Solution of heat exchange coefficient The difference iterative method in 2.1 was used to obtain Ti,n, combining with the measured values T* in annex 2, and the least square method was used to solve the following optimization problems:
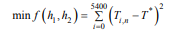
Finally, use the chasing method to obtain parameters that h1 =135.094m2 /s and h2 =8.366m2 /s, respectively.
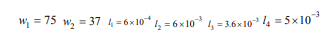
The known parameters used (all have been converted to standard units)
Temperature distribution
Use the obtained parameters h1 , h2 , and the differential iteration method in 2.1, we find the temperature distribution of each point at each moment as shown in Figure 3. According to (Figure 4), it can be found that the temperature of the protective clothing changes monotonously with the distance and time from the origin, and finally stabilizes, that is, the ambient temperature given by the problem is 75 ºC, which basically conforms to the actual situation.
Skin layer heat conduction and burn model
In order to further determine the optimal thickness of the thermal protective suit, it is first necessary to determine the temperature value of the skin layer, so it is considered to add a layer on the right side of the skin surface to be the skin layer. We analyze generalized
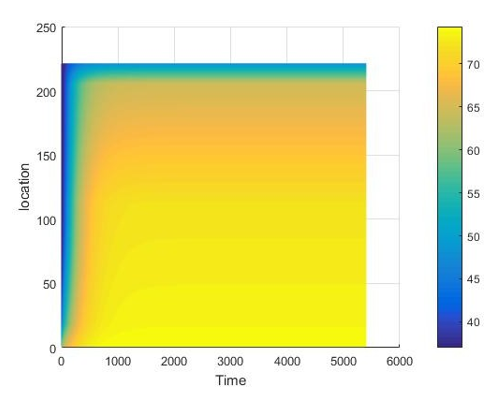
Figure 3: Temperature at each point in each moment.
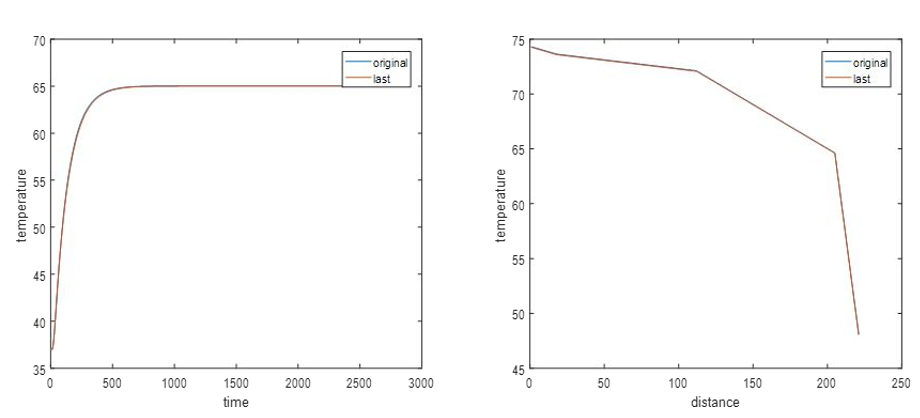 Figure 4: Sensitivity analysis chart.
equation, boundary conditions and initial conditions of the skin layer as follows.
Generalized equation: The Pennes biothermal transfer model introduced in the literature [13] was determined as,
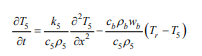
among them k5 is the thermal conductivity of the skin, wb is infusing blood, c5 ,ρ5 are the density and specific heat of the skin layer 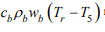 represents the
energy of heat exchange between human cells and blood.
Boundary conditions: The left side of the skin layer is the interface between the air layer and the skin surface, and may involve thermal radiation, and the heat radiation gradually decays from the first layer toward the skin layer.
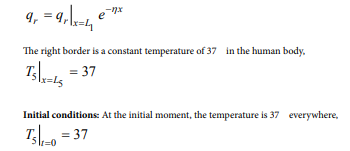
Establish the heat transfer model of the 5th layer,
The above equation is differentiated by the forward difference method, the skin surface temperature is calculated from the difference expression and the initial condition and the boundary condition, and the squared sum of difference of the theoretical value and the measured value is used to determine the parameter in the skin layer heat transfer model. In order to make the research meet the actual needs, we analyze the degree of burns [14].
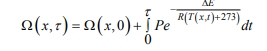
among them ∆E is skin activation properties, P is the frequency disruption factor. When Ω ≤ 0.53, no burns will occur. 0.53 < Ω ≤ 1, a first-degree burn occurs, 0.53 < Ω ≤ 104 , second-degree burn occurs. Ω > 104 , third-degree burn
Sensitivity analysis
Since the data given by the accessory is measured, the measurement error generally shows a normal distribution. Sensitivity analysis is now performed on the model. Add the raw data to the measurement error with a mean of 0.01 and a variance of 0.01 and recalculate. When t=2000, a temperature along with time t changing image is drawn. When x=200, a temperature along with distance x changing image is drawn. It is known from the image that when considering the measurement error, the calculated temperature value is not much different from the temperature value calculated from the original measurement data, and only some random fluctuations are generated on the basis of the original data, and the overall trend of the image does not change much. Therefore, the model and algorithm we have established are highly stable.
Conclusion
In this paper, a temperature distribution model is established for thermal protective clothing at high temperature. The temperature distribution of each layer of thermal protection at a specific ambient temperature is studied, and the optimal thickness of each layer is obtained by combining specific temperature and thickness constraints. In the real environment, it is necessary to consider factors such as changes in the influence of human sweat and the moisture contained in the fabric itself, and it is possible to establish a heat and moisture transfer model under transient conditions in a multi-layer fabric combination state, and the radiant heat transfer between the layers is studied in depth, and the influence of the initial water content is analyzed, and the changes in the physical parameters affected by the water content in the model are analyzed.
Acknowledgement
This work was supported by the Philosophical and Social Sciences Research Project of Hubei Education Department (19Y049), and the Staring Research Foundation for the Ph.D. of Hubei University of Technology (BSQD2019054), Hubei Province, China.
References
- Miao Tian, Jun Li (2015) Application of numerical simulation in performance evaluation of thermal protective clothing. Journal of Textiles 36(1): 158-164.
- Dongxia Zhang, Fengzhi Guo (2007) Application of phase change materials in temperature control clothing. Knitting Industry (3): 28-31.
- Fanglong Zhu, Jianbin Fan, Qianqian Feng, Yu Zhou (2014) Application and feasibility analysis of phase change materials in firefighting suits. Journal of Textile Research 35(8): 124-132.
- Chao Zhang, Tingxin Qin, Jinyu Wang (2013) Discussion on evaluation standards of overall protective effect of thermal protective clothing based on human physiological indexes. Standard Science (9): 43-46.
- Jianbo Lin, Haibo Yin, Yongqiang Cao (2015) Radiation resistance of firefighter’s thermal protective clothing. Fire Science and Technology 34(2): 241-243.
- Slapak MJ, Cheng Yan (1992) PBI fiber used for making heat-resistant protective clothing. Foreign textile technology (chemical fiber, dyeing and finishing, environmental protection volume) (3): 6-11.
- Jie Yang, Rixiang Qiu (2012) Application research and development of police thermal protection materials. China Personal Protective Equipment (4): 5-9.
- Hongyan Li, Xuanrun Wu, Yuyuan Zhang, Kai Yang (2008) Relationship between fabric properties and comprehensive protection ability of thermal protective clothing. Journal of Textiles (9): 59-61.
- Lanping Shen, Yiling Li, Hairong Pan, Lihong Fan (2000) Development of double-layer flame-retardant and heat-resistant protective clothing fabrics. Beijing Textile (1): 46-47.
- Weiwei Wang, Cheng Wang, Yuyue Pan, Hui Wang (2018) Optimization design of high temperature protective clothing based on Fourier's law of heat conduction. Electronic Test (23): 53-55.
- Linzhen Lu, Dinghua Xu, Yinhong Xu (2008) Prediction of skin burn degree using an improved heat transfer model of three-layer thermal protective clothing. Textile Journals 39(1): 111-125.
- Linzhen Lu (2018) Heat transfer model and optimal parameters of multi-layer thermal protective clothing. Zhejiang University of Science and Technology, China.
- Qinghua Chen, Changshuai Dong, Yan Ma, Li Pang, Zegong Liu (2015) Measurement of thermal properties of solid materials based on one-dimensional unsteady heat transfer model with constant temperature boundary. Journal of Central South University: Natural Science Edition 46(12): 4686-4692.
- Pan Bin (2017) Mathematical modeling of thermal protection garment heat transfer and parameter determination inverse problem. Zhejiang University of Science and Technology, China.
Citation: Cao J, Jiang X and Zhao B. On the Human Infectious Disease COVID-19 Protective Clothing. J Miner Sci Materials. 2020; 1(1): 1002.